Part 2. Creating your first dashboard
Step by Step Guide: How to Create Your Own Dashboard on Alphacast
Dashboards let you combine charts and text, and see the data always up to date on a single glimpse. You can use your own charts or created by other users that are public.
- Dashboards, like every other object in Alphacast, are stored in repositories, which can be found on your home screen.


- Before creating your dashboard, clip the charts that you want to use by clicking on the clip button at the bottom on any chart. Once clipped, these charts will be found on the clipboard :paperclip: at the top right of your screen.

-
Now go to Create New Dashboard on the top right, and then select Switch to Dashboard View to begin creating your dashboard.
-
To add charts to your dashboard, simply, select drag and drop them onto the canvas. You can resize and rearrange them as desired, as well as edit the timeline.
-
If you want to include text in your dashboard, drag and drop a textbox and add Markdown text.

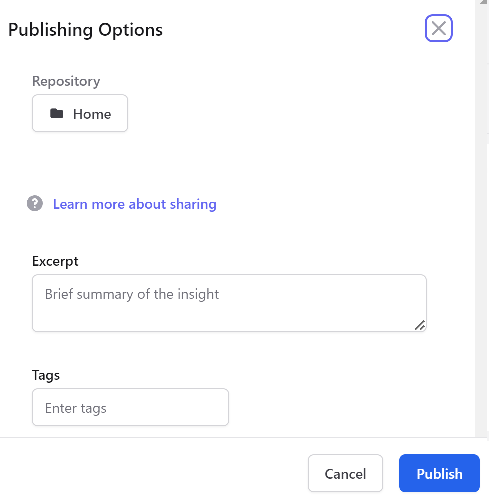
- Once you have finished creating your dashboard, click on the publish button and select the repository where you want to place it.
Congrats! You have successfully created and published your first dashboard.
Last updated on August 26, 2024