Calculate variables
The calculate variable step is an all-purpose formula parser to create new variables in a more "Excelish" way. There are dozens of operators, comparisons, and functions that allow endless combinations. For a comprehensive list of functions and operands see here (opens in a new tab)
Video Tutorial (Spanish)
First step. Writing a basic formula
The first step is to create a pipeline (click on "Create new --> Pipeline" on the top right) and select a data source, followed by "add step below --> Calculate Variable"
There are a couple of rules to creating new variables
- Select a name on the textbox. If you select a variable name that already exists it will be overwritten
- You can use @ to select variables of the dataset. Start writing the name of the variables and options will show up
- You can do basic arithmetic operations such as (+, -, *, /, ^): @column1 + 3
- You can use functions by typing the name followed by parenthesis and commas to separate parameters: round(@column) + @column2. Full list of functions is here: here (opens in a new tab).
- The formula will always return the same number of rows as the original datasets, even if it involves calculations that usually reduce the dimensionality such as "Total sum per group". Check group and rolling windows functions below.
@Close + @Volume * 2)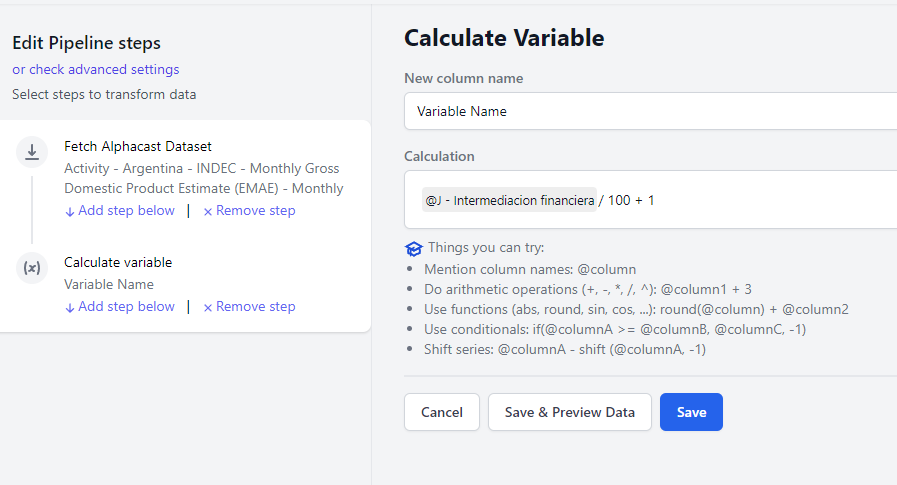
Row Functions
Row functions are those that are calculated using only information from a single row in the dataset. That is, no values from other periods or entities are used in the calculation. This includes functions such as power, exp, sqrt, log, abs, trunc, round,sin, cos, etc.
log(@Close)+ sqrt(@Volume))Nested calculations
Calculations can be nested inside other calculations to be used as parameters
log(exp(@Close))Group Functions
Group functions are used to make calculations for subgroups within the dataset. The data is split by the unique values of the entities defined in the parameters and calculations are done for each separate group. Entities can be the real entities of the dataset or any other variable or even the result of nested calculations.
There are dozens of group functions. See a comprehensive list here (opens in a new tab)
Example: Calculate for each ticker the cumulative price change vs the first price
@Close / first(@Close, @Ticker)

Example: Calculate the cumulative sales per salesperson
cumsum(@sales, @salesperson)

Example: Calculate for each date the share of sales explained by each product vs the total sales of that date
@sales / sum(@sales, @date)
Rolling Window Functions
Rolling windows are a special class of group function where calculations are made within a group AND within a rolling window. The user has to define the number of periods to be included in the rolling calculation
Example: calculate the 20 day moving average for each ticker
rollingmean(@Close, 20, @Ticker)
Date and time Functions
Date and time functions are performed over DateTime variables (usually the @Date entity of the dataset) and include functions such as year, month or day, week, dao_of_year and more
Example: Extract the year from the date entity
year(@Date)