Portfolio Stats and Tear Sheets Calculator
Alphacast pipelines can be used to design and test portfolio and trading strategies. With the "Portfolio Analysis" Step on the pipeline editor, you can create tear-sheets from daily returns and also dynamic rolling stats for different timeframes.

- Load the data and calculate a daily return variable.
You can use any dataset you want to calculate daily returns. As an example, let's load Yahoo Finance data and calculate the daily return of three assets
-
In the pipeline editor (Click on create new at the top right --> Pipeline)
-
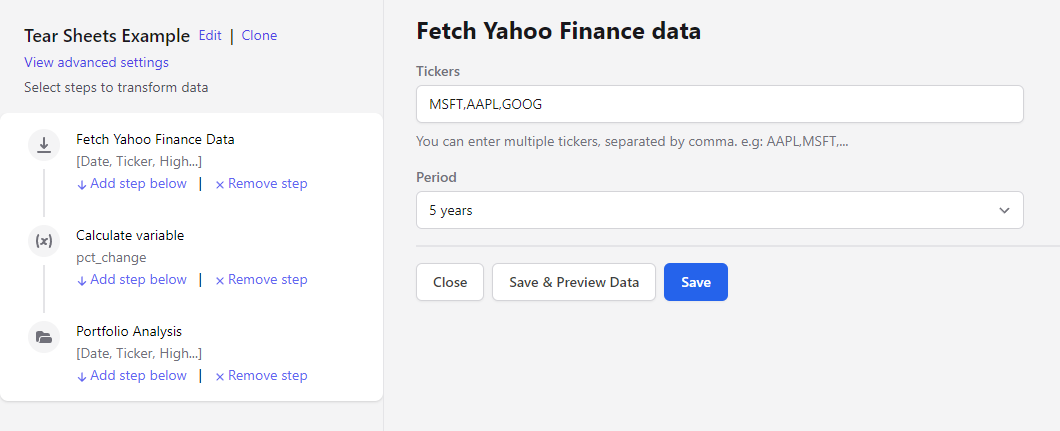
Add Yahoo Finance as your source
-
add the tickers that you want to analyze (i.e. MSFT, AAPL, GOOG)
-
Select the period
-
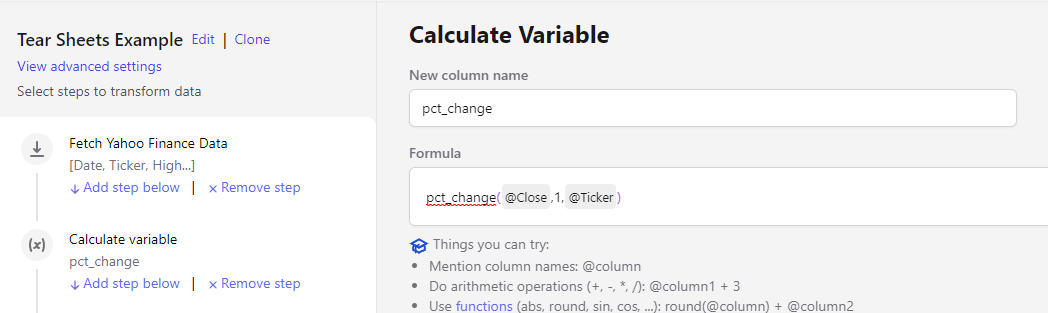
add a new step to "Calculate Variable" write the formula
pct_change(@Close,1,@Ticker)

2. Calculate the portfolio Tear Sheet
- Add a new step Portfolio Analysis
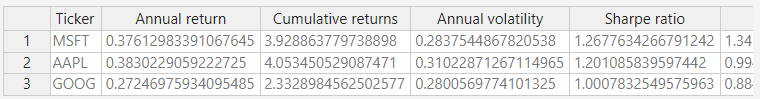
- Select the metrics that you want to calculate for your portfolio. Available stats are'**Annual return, Cumulative returns, Annual volatility, Sharpe ratio, Calmar ratio, Stability, Max drawdown, Omega ratio, Sortino ratio, Skew, Kurtosis, Tail ratio, Daily value at risk, Total Return
- Select the variable with the daily returns. "pct_change" in this example
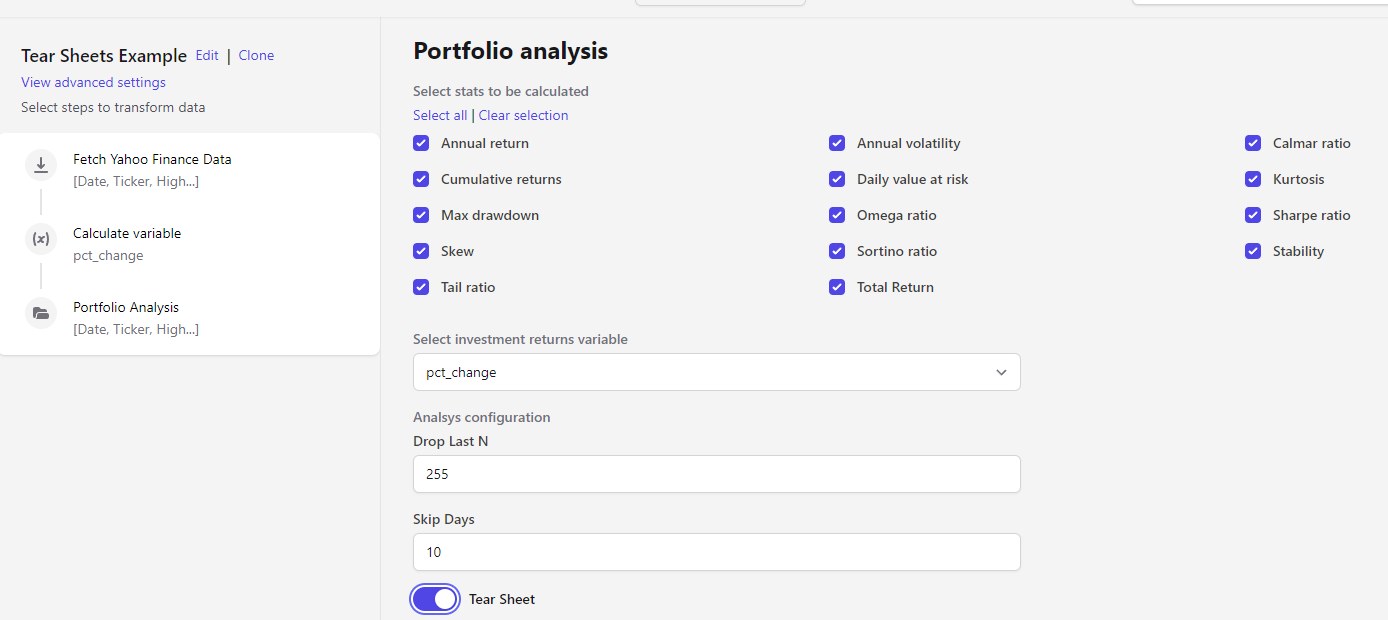
If Tear-sheet option is on then a single Tear sheet with results will be calculate for the whole sample period
If Tear-sheet option is off then stats will be estimated recursively for each day of the sample, estimating the stats calculated with data from that day up to the most current day.
In this case, two additional parameters are required
- dropLastN implies that stats will not be calculated from the timeframes that begin in the last N days. Default excludes 252 trading days.
- Skip days mean that the start will be calculated from timeframes with start days every N days. This parameter is important for performance reasons. Default is 10 days.
The resulting dynamic Tear Sheet will look like this dataset (opens in a new tab)
Optional. Calculate Technical analytics for your portfolio
Remember that with the Technical Analysis: step you can estimate 130 metrics for Technical Analysis of financial assets, Metrics include a number of cycles, momentum, volatility and volume Indicators, standard overlap studies, patterns recognition techniques, or statistic functions.Learn More (opens in a new tab)